
In the previous section we looked at how to build basic plots of your Bearable data in python.
Today we are going to check out correlations between factors, just like we did in R.
Correlations in Bearable
We will need two packages for today’s exercise: For manipulating data we will use Pandas and Seaborn for visualizing.
import pandas as pd
import seaborn as sn
import statsmodels.api as sm
We start by importing and filtering the relevant data.
data = pd.read_csv("./data/latest.csv")
df = data[(data["category"] == "Mood") | (data["category"] == "Factors") | (data["category"] == "Meds/Supplements")]
Let’s split the factors into our data frame.
df2 = df.copy()
for index, row in df.iterrows():
    curr_date = row["date"]
    same_dates = df[(df["date"] == curr_date) & df["detail"]]
    df2["detail"][index] = ' | '.join(same_dates["detail"])
As before now we have all the factors for every date, but we only need a single date with the relevant factors. Let’s drop the duplicates.
df2 = df2.drop_duplicates(subset = ["date"])
Now let’s write back the factors into the dataframe.
for index, row in df2.iterrows():
    details = row["detail"].split(" | ")
    for i in details:
        if not i in df2.columns:
            df2.insert(0, i, [False]*len(df2))
        df2.loc[index, i] = True
Reading correlations
We can ask correlation questions from our dataframe, such as:
df2.Sedentary.corr(df2.Snowing)
> 0.7921180343813403
Let’s see if it’s statistically significant:
x = sm.add_constant(df2.Snowing.values.astype(int))
y = df2.Sedentary.values.astype(int)

model = sm.OLS(y, x).fit()
model.summary()
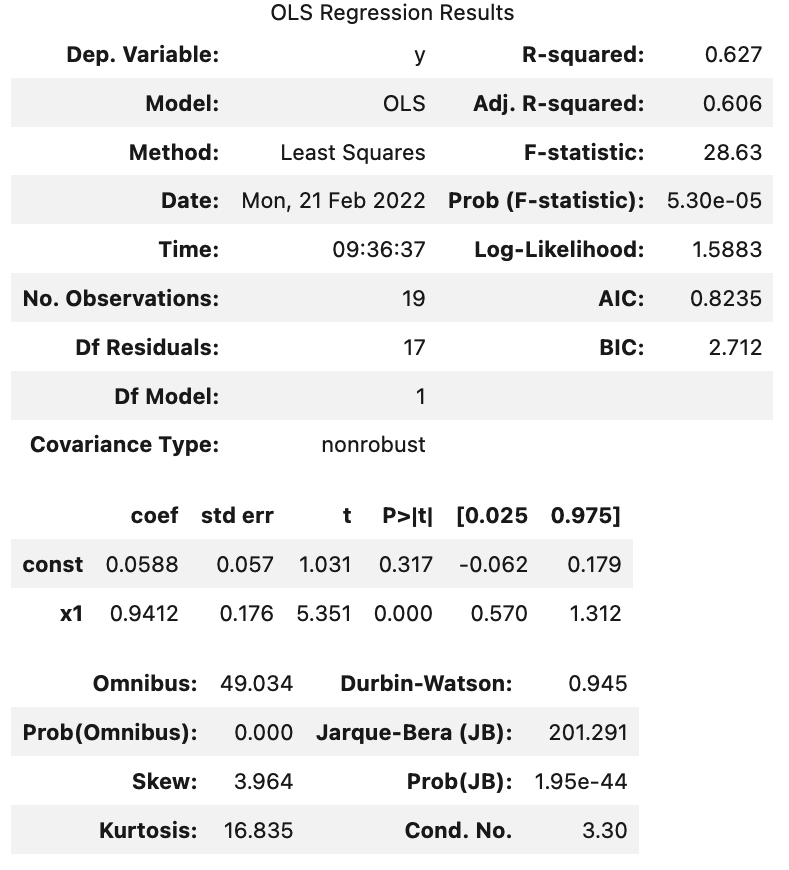
We can see that x1 P is smaller than 0.05, so we can conclude it is statistically significant.
Visualization
We will use seaborn to visualize the correlation table.
sn.set(rc={'figure.figsize':(11.44, 8)})
sn.heatmap(df2.corr(), center=0, vmin=-1, vmax=1)
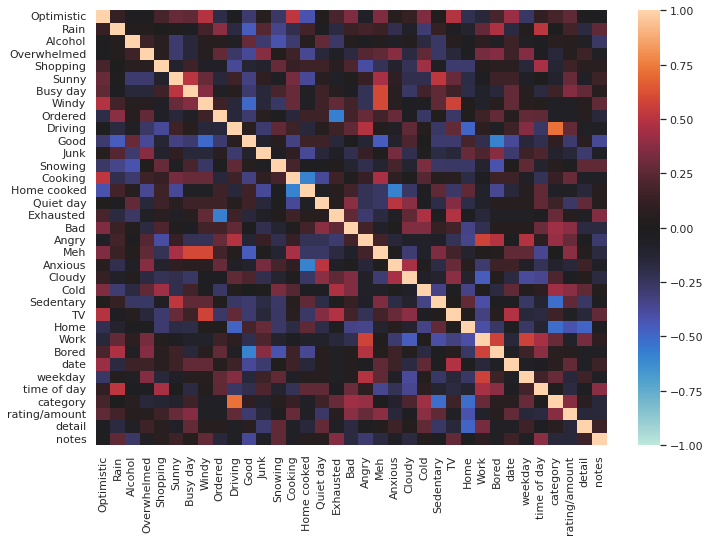 (Data is generated for privacy reasons)
Conclusion
Visualizing correlations is similar in Python and R, while it’s slightly faster to run in python.
