
OPNSense
OPNsense is an open source, easy-to-use and easy-to-build FreeBSD based firewall and routing platform. It’s gaining in popularity against PfSense. Which is better to use is the topic of an entirely different blogpost.

We will use Zabbix to monitor our instance as opposed to something like Telegraf, just because Zabbix is an official package for OPNsense.
Zabbix
Zabbix is a server monitoring platform. Let’s enable the agent on OPNsense:
Install Zabbix on a server using Docker
Use the following docker-compose file:
version: '3'
services:
  zabbix-server:
    image: zabbix/zabbix-server-pgsql:latest
    environment:
      - DB_SERVER_HOST=db
      - POSTGRES_USER=zabbix
      - POSTGRES_PASSWORD=zabbix
      - POSTGRES_DB=zabbix
  zabbix-web:
    image: zabbix/zabbix-web-nginx-pgsql:latest
    environment:
      - DB_SERVER_HOST=db
      - POSTGRES_USER=zabbix
      - POSTGRES_PASSWORD=zabbix
      - POSTGRES_DB=zabbix
      - ZBX_SERVER_HOST=zabbix-server
    ports:
      - "8080:8080"
  db:
    image: postgres:14.2
    environment:
      - POSTGRES_USER=zabbix
      - POSTGRES_PASSWORD=zabbix
      - POSTGRES_DB=zabbix
    volumes:
      - ./zabbix-db:/var/lib/postgresql/data
  grafana:
    image: grafana/grafana
    environment:
      - GF_INSTALL_PLUGINS=alexanderzobnin-zabbix-app
    volumes:
      - ./grafana:/var/lib/grafana
    ports:
      - "3000:3000"
Enabel Zabbix for OPNsense
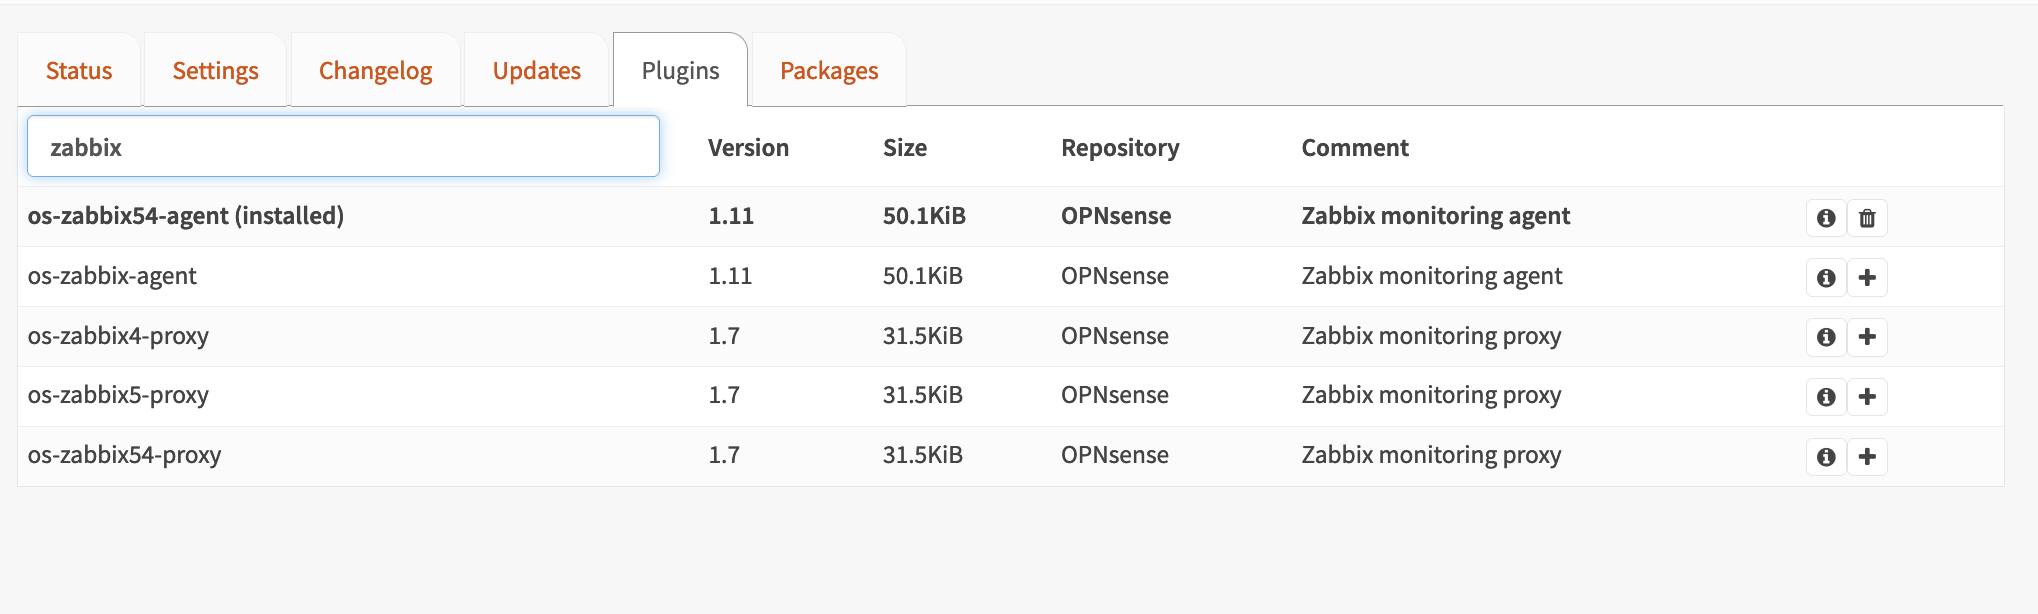
Go to System > Firmware > Plugins. And install os-zabbix54-agent.
Now go to Services > Zabbix agent > Settings and select Enable.
Add the ip address of your server to the Zabbix servers field.
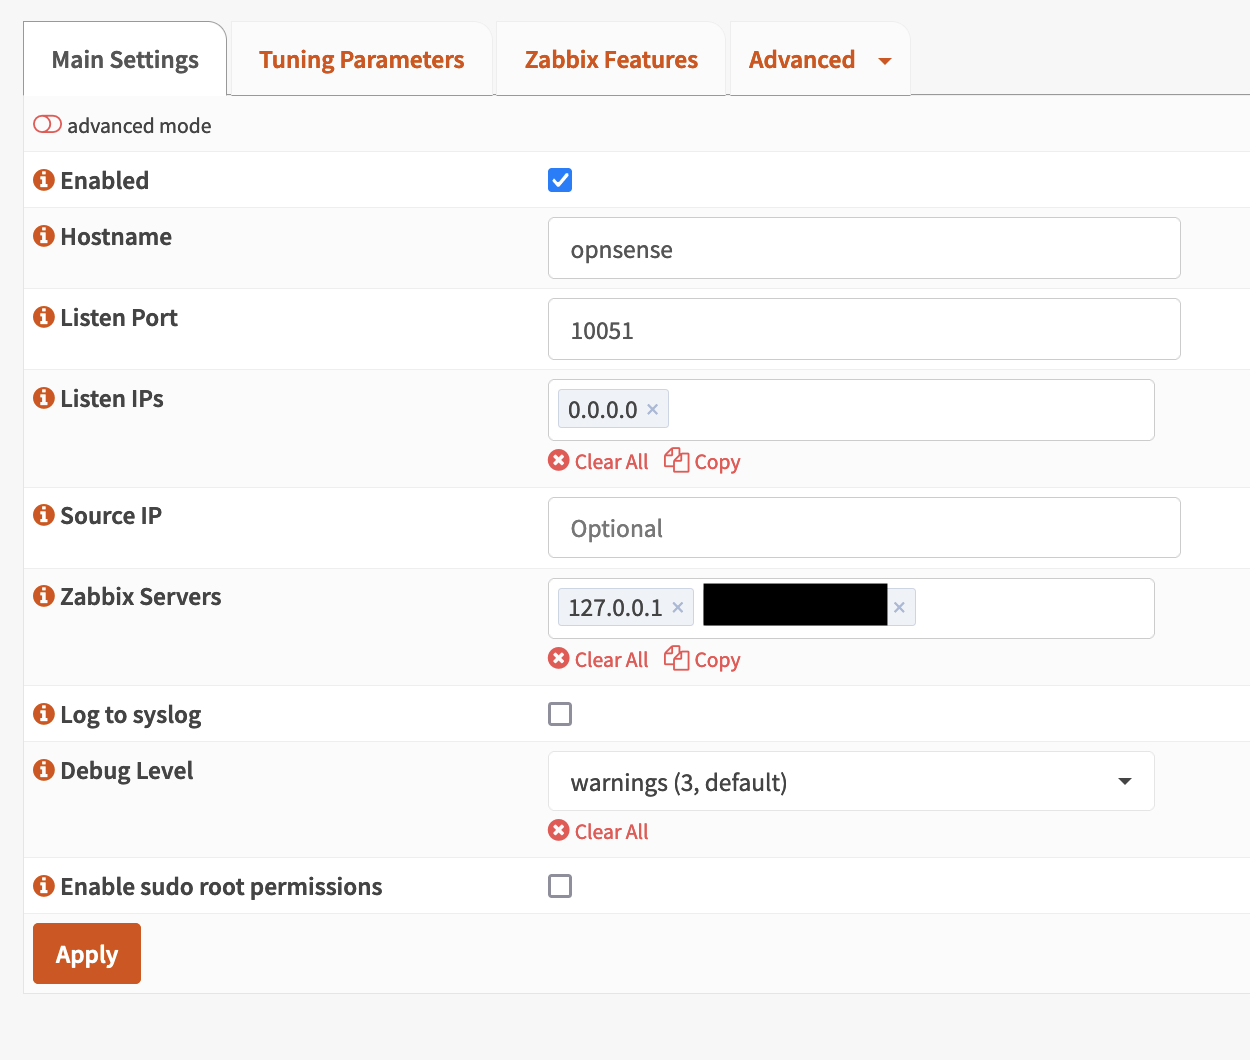
Hit Apply, make sure the service is running on the front page, and you are good to go.
Configure Zabbix
Open http://[ip]:8080 and follow the instructions. Your backend will be postgresql with the host db, username, password and database are all zabbix.
Set your admin account and remember the password.
Add Opnsense to Zabbix
Go to Monitoring > Hosts > Create Host at the top-right corner.
Enter your OpnSense ip address as Hostname, and at Templates add FreeBSD by Zabbix agent.
Grafana
Grafana is installed with the above docker-compose file. Open http://[ip]:3000, the default username and password are admin, which you ought to change.
Let’s add Zabbix as a data source:
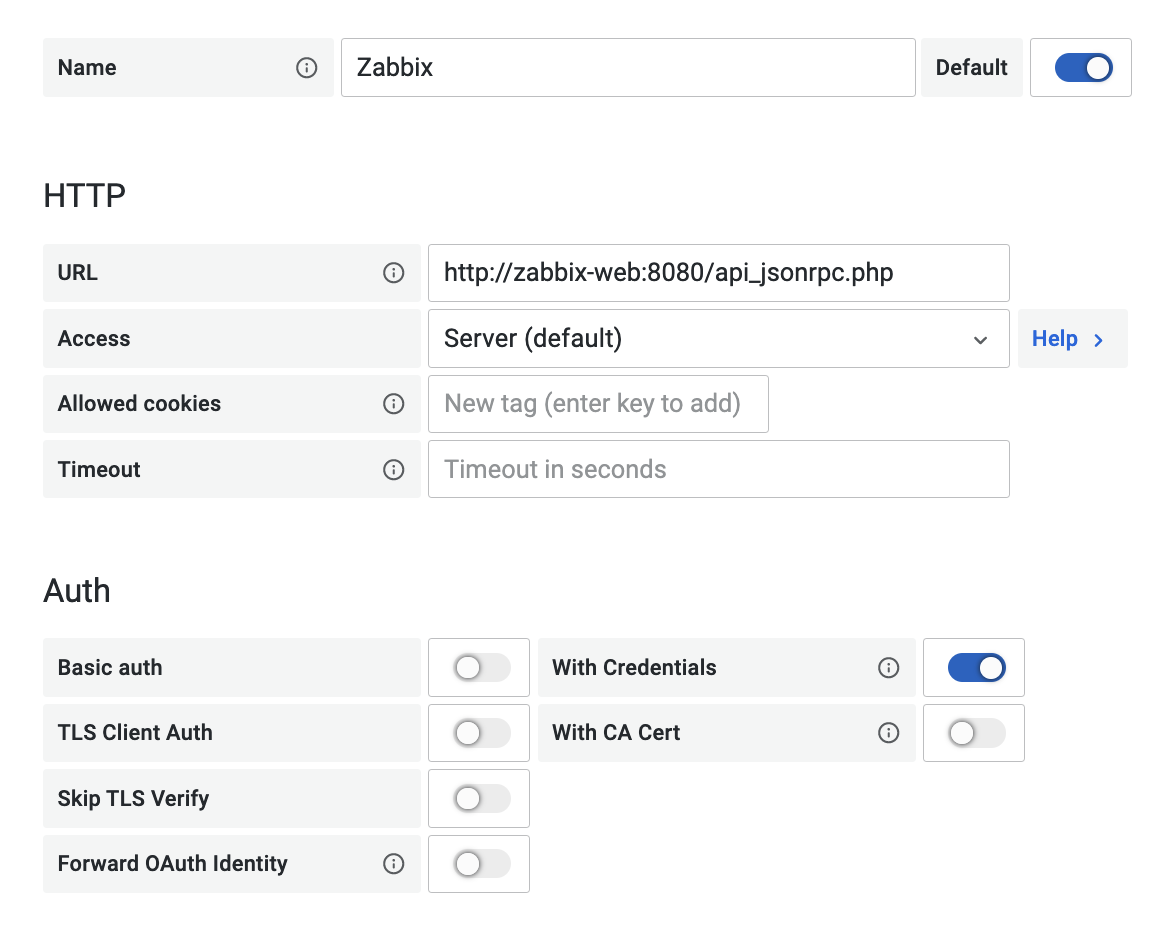
The url is http://zabbix-web:8080/api_jsonrpc.php, remember to enable With credentials and enter your username and password.
Add PostgreSQL as Direct DB Connection (Optional)
To speed up data retrieval we can ask Grafana to read the PostgreSQL database directly. To do so add a new data source:
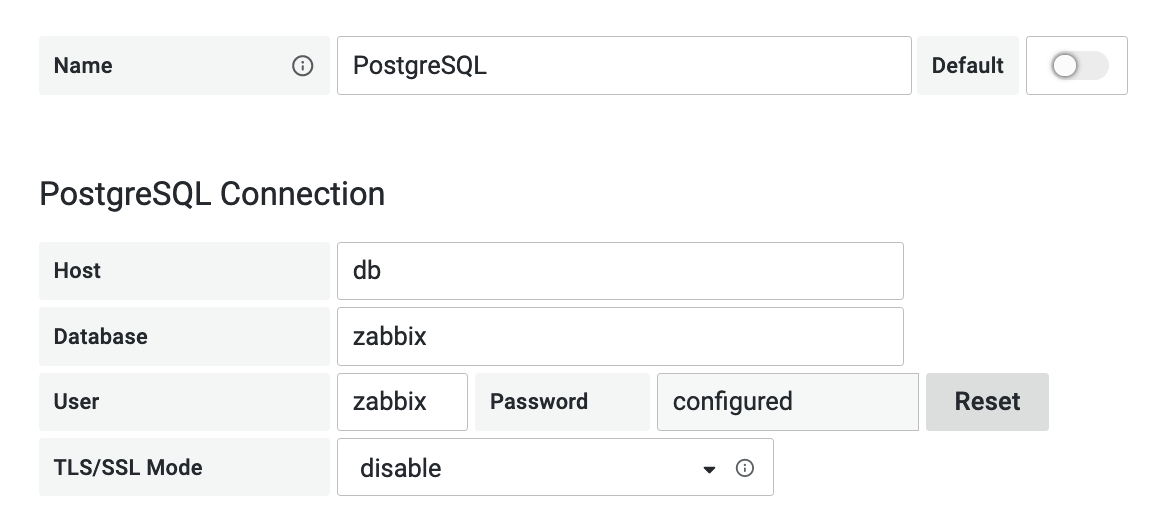
The username, password and database are all zabbix as per our docker-compose file.
Now go back to the Grafana data source and enable Direct DB Connection.
Creating dashboards
You are now ready to create Dashboards, such as:

